Most Chrome power users know that the browser ships with a barebones task manager that lets you track CPU and memory usage, and this carries over into ChromeOS and ChromeOS Flex too. But, did you know that in ChromeOS Flex, there’s actually a slightly more powerful way to monitor CPU and memory usage as well as see the health of your laptop’s battery? In this guide, I’ll show you how to access these slightly buried tools.

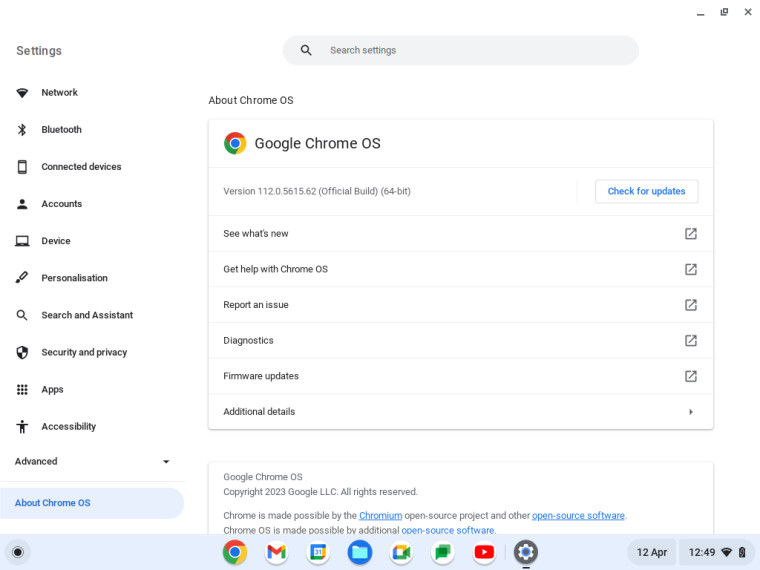
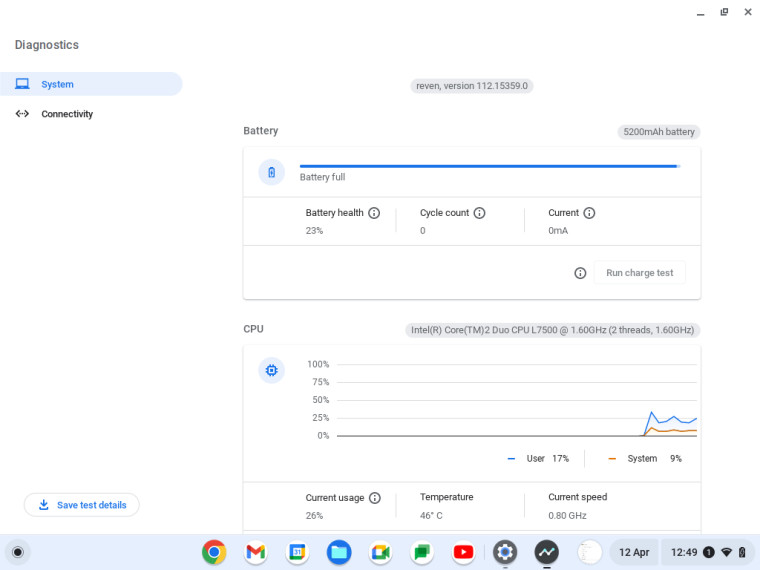
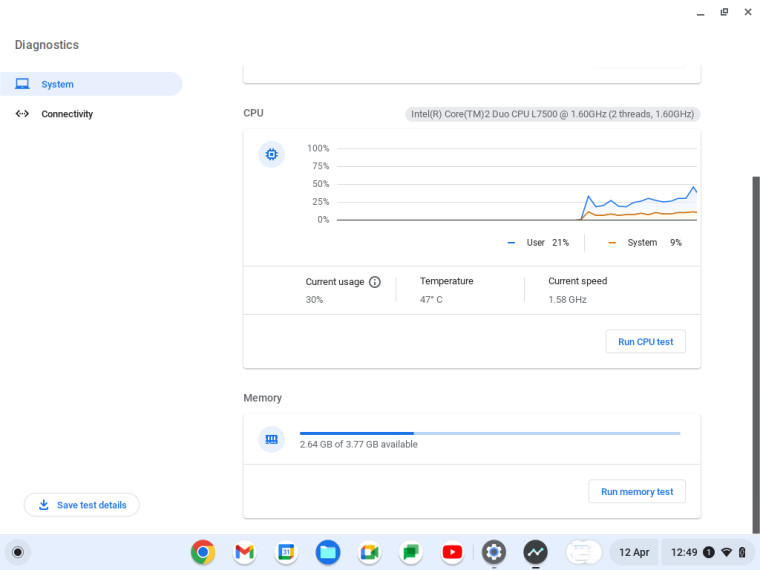
To open up these tools, open up the Settings app in ChromeOS or ChromeOS Flex and head to About Chrome OS at the bottom of the left-hand pane. From there, open up Diagnostics in the main portion of the window. Here, you’ll see three sections, Battery, CPU, and Memory. Each of these sections shows additional information too and there are buttons to run respective tests.

In the battery section, you can see how full the battery is, the battery's health, the cycle count, and information about the current. Under CPU, you can see your CPU ID, a graph tracking usage of each user and the system, the current usage, the temperature, and the current speed. Finally, in the memory section, you can see how much memory has been used up and how much is available.

Hopefully, these pointers will be useful to people with a new Chromebook or to those who are testing out ChromeOS Flex for the first time and are wondering where these important tools are. The task manager accessible from More Tools in the browser is useful for closing down troublesome tabs but it’s not very good for giving an overview of the system’s performance. Hopefully, with these diagnostic tools, you can better track your system’s performance.


_small.jpg)


1 Comment - Add comment
Advertisement